It's official: Gardeners and farmers can count on warmer weather. If that's you, it might be a good time to rethink those flower and vegetable beds for this year's growing season.
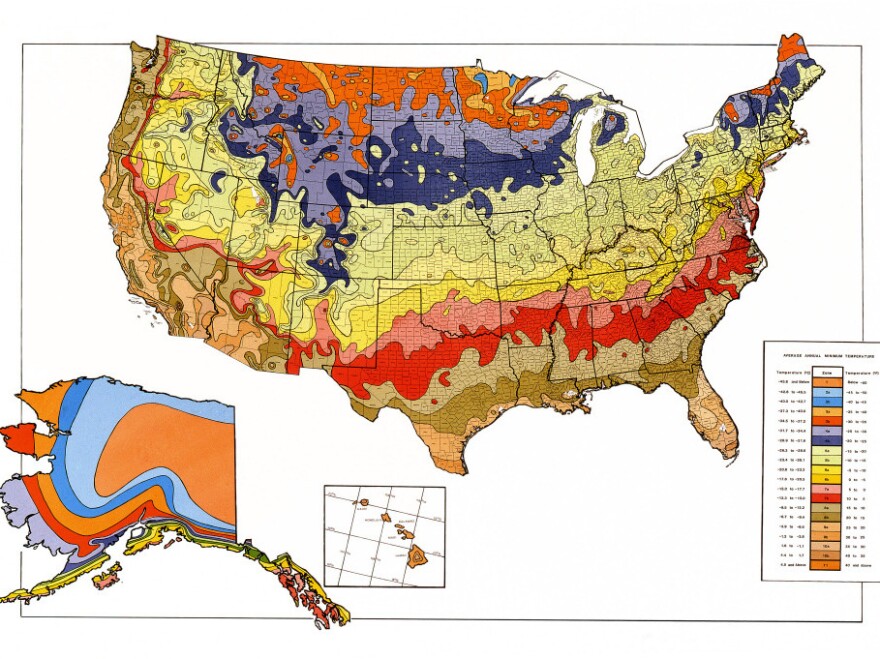
That's the word from the U.S. Department of Agriculture, which released a new version of its "Plant Hardiness Zone Map" this week, the first update since 1990. The color-coded zones on this map of the United States are widely used as a guide for what perennial flowers will survive in a particular area, or when to plant your vegetables.
Here's how it works: The higher the zone number, the warmer your average low temperature during wintertime.
Now the zones have shifted northward. The new map shows that in much of the country, winters aren't as cold as they used to be, and spring planting comes earlier.
So if you're thinking of planting a White Dogwood tree in your front yard, for instance, you may have read that it will thrive in zones 5-8, which covers most of the southern half of the country.
But if you live in northern Iowa — good news — you can now plant that tree! You are now in zone 5, instead of 4.
Gardeners in Manhattan, Kansas, may also rejoice over new options now that the town has moved from zone 5 to zone 6. The new version of the map also includes two new zones at the warmed end of the spectrum: zone 12 (50-60 degrees Fahrenheit) and 13 (60-70 degrees Fahrenheit).
The nationwide shift in the planting season provoked lots of questions about just how much to attribute to climate change. USDA officials, while introducing their new map to reporters, insisted that they were making no claims about global warming.

Some of the shifting zone boundaries, they said, were the result of more sophisticated mapping. For the first time, the new map takes into account the effects of elevation, large lakes, and whether a place is located in a valley or on top of a ridge. They admitted, however, that most of the changes were due to using temperature data from recent years, which have been relatively toasty.
Unlike previous hardiness maps, the USDA won't sell poster-sized versions of this one. But there's an interactive version, available on the web, where you can explore the map in exquisite detail.
Copyright 2020 NPR. To see more, visit https://www.npr.org.


